


Using Visual LISP Data Inspection Tools
VLISP gives you almost unlimited access to symbols, values, and functions at any stage of program execution. The VLISP data inspection tools are implemented as modeless windows (except for the Symbol Service dialog box), meaning they stay on the screen as long as you need them, no matter what your program does.
VLISP provides a logging feature that, when active, allows you to copy the contents of a Data Inspection window to a log file.
To turn trace logging on and off
 Toggle Trace
Log from the VLISP menu. Note that if the Trace window is not
active, the Toggle Trace Log option will not be available.
Toggle Trace
Log from the VLISP menu. Note that if the Trace window is not
active, the Toggle Trace Log option will not be available.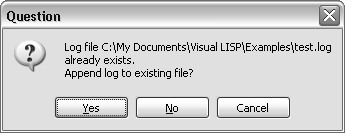
If you reply Yes, VLISP appends new data to the current contents of the file. If you reply No, VLISP overwrites the file and its original contents will be lost. Choose Cancel to terminate the operation and specify a different file name.
When Trace logging is turned on, any information displayed in the Trace window is also written to the log file. Most VLISP data inspection tools provide a toolbar button for copying data to the Trace window.
The state of Trace logging is indicated in the Trace window's title bar. If logging is in effect, VLISP displays the name of the log file in the title bar. If logging is off, no file name appears in the title bar.
If you do not close the log file before exiting VLISP, it closes the file automatically upon exit. After a log file is closed, you can view its contents with any text editor, such as the VLISP text editor.