


AutoLISP
Developer's Guide > Using the Visual
LISP Environment > Debugging
Programs > Using Visual LISP
Data Inspection Tools >
Understanding the Trace Stack Window
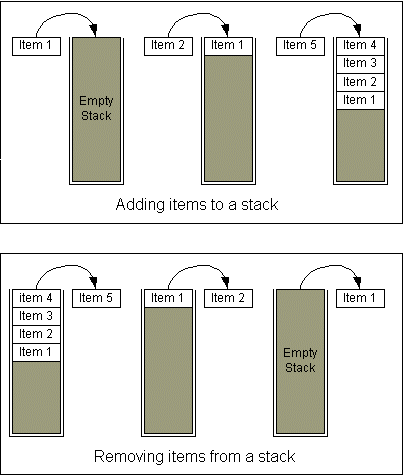
VLISP has a special debugging tool called a trace stack which is a historical record of the execution of functions within your program. (The term stack is derived from a computer programming structure of the same name.) The following figure illustrates adding and removing items from a stack. You can see why a stack structure is often referred to as LIFO—Last In, First Out:
The trace stack is used by VLISP to “remember its way out” of a nested series of expressions. By viewing the stack, you can see what is happening within your program as it is executing (within a suspended break mode) or immediately after it has crashed.
Before you invoke a function at the Console window or from AutoCAD, the trace stack is empty. The action of invoking a function causes a record, or element, to be placed on the stack. As that function calls additional nested functions to perform the work of your program, additional elements may be added to the stack. VLISP only needs to place elements on the stack when it needs to remember its way out of nested functions.
There are two conditions where it is useful to examine trace stacks. The first is when your program is in a suspended state, such as during a breakpoint pause. The second is after an error occurs, causing your program to fail.