The dashboard is a special palette that displays buttons and controls that are associated with a task-based workspace.
The dashboard provides a single interface element for operations that are relevant to the current workspace. The dashboard eliminates the need to display a lot of toolbars and reduces the clutter in the application window. Thus, you can maximize the area available for work, and use a single interface for speed and convenience.
The dashboard opens automatically by default when you use either the 2D Drafting & Annotation workspace or the 3D Modeling workspace. You can open the dashboard manually:
 Palettes Dashboard
Dashboard Organization and Operation
The dashboard is organized into a series of control panels. Each control panel includes related tools and controls that are similar to the tools in toolbars and controls in dialog boxes.
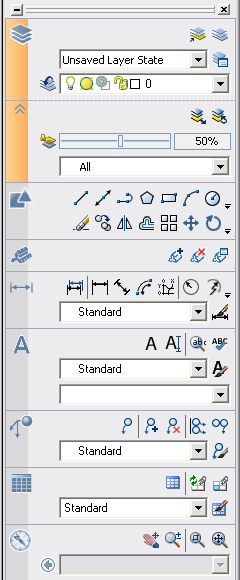
The large icons displayed at the left side of the dashboard are called control panel icons. Each control panel icon identifies the purpose of the control panel. On some control panels, if you click the icon, a slide-out panel opens that contains additional tools and controls. An open slide-out panel closes automatically when you click another control panel icon. Only one slide-out panel is displayed at a time.
A tool palette group can be associated with each control panel. To display the associated tool palette group, click a tool or open a slide-out panel.
Display or Hide, Dock, and Resize the Dashboard
You can customize the display of the dashboard in the following ways:
You can customize the dashboard in the following ways:


