


AutoLISP
Developer's Guide > Using the Visual
LISP Environment > Debugging
Programs > Using Visual LISP
Data Inspection Tools > Understanding the
Trace Stack Window >
Viewing an Error Trace Stack
If your program terminates due to an error, choose Error Trace from the View menu to see the state of function invocations up to the time your program crashed:
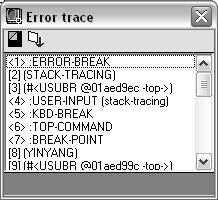
The error trace is a copy of the trace stack as it appeared at the time the error occurred. If the Break on Error debugging option is selected, the error trace and the trace stack are identical immediately after an error occurs. You can see this by selecting Break on Error from the Debug menu, intentionally causing an error (for example, issuing a function call that divides by zero), and opening the two trace windows.
The toolbar on the Trace Stack window contains two buttons:

Refreshes contents of Trace Stack window.

Copies the window contents to the Trace Stack window or open log file.
When you issue a Reset command to exit a break loop (for example, Reset to Top Level), pressing the Refresh button in the Trace Stack window replaces that window's contents with the latest trace stack data. In contrast, refreshing the Error Trace window does not change the window's contents, unless a subsequent error has occurred.