VLISP provides you with an entire toolkit of programming and debugging tools. One of the most valuable tools is a Watch, which lets you examine variables in more detail than appears in the VLISP Console window. You can also watch local variables within functions as the function executes.
To watch the value of a variable
 Add Watch from the VLISP menu.
VLISP displays a dialog box titled “Add Watch.”

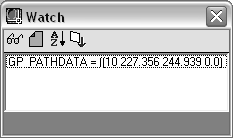
Enter the name of the variable you wish to examine. For this example, specify gp_PathData, the variable you just set from the Console window. VLISP displays a Watch window:

VLISP displays the value of the variable on a single line within the Watch window—the base window shown in the illustration. In this case, the value of the variable is a long list, and you cannot see its entire value. You can resize the Watch window by dragging its border, but there is a better alternative.

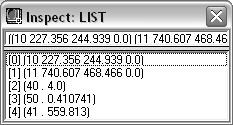
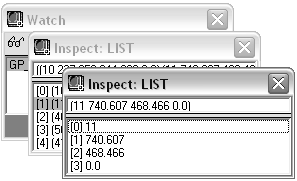
The Inspect window indicates the data type of the variable you are inspecting (in this case, a list), and the value of the variable. For lists, Inspect displays each list item on its own line.
