


AutoLISP
Developer's Guide > Using the Visual
LISP Environment > Debugging
Programs > Using the Visual
LISP Debugging Features > Using
Breakpoints >
Listing and Viewing the Breakpoints in Your Program
From the View menu, choose Breakpoints Window to see a list of all breakpoints currently defined to VLISP:
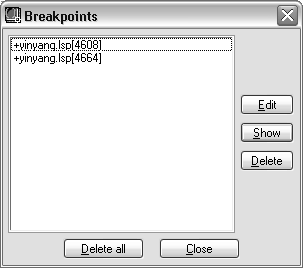
The Breakpoints dialog box lists the breakpoints in all programs you are editing in VLISP, not just the program in the active editor window. In the example above, only one program (yinyang) contains breakpoints. But you could have breakpoints set in any number of files.
Each entry in the Breakpoints dialog box shows the name of the source file containing the breakpoint, and the location of the breakpoint in the source. A leading + or - sign differentiates between active and disabled breakpoints. The dialog box allows you to delete all breakpoints at once or to edit (or display) one breakpoint at a time. Choose Show to display the source position of the breakpoint. The Edit button opens the Breakpoint Service dialog box, from which you can disable the breakpoint.